Wrangling Legacy Data: Preparing for Sociotechnical Change in the Smart City
This research was produced in collaboration with Dr. Jennifer Clark and Emma French, and through the considerable labor of Chris Thayer.
–
From connected traffic signals and self-reporting trashcans to automated mobility vans and apps for reporting potholes, smart cities promise to make urban areas more efficient, increase the capacity and options of government and public services, and drive decision-making. These visions are predicated on the use of various advanced (and often computational) technologies that can reveal insights, inform decision-makers and citizens, predict outcomes, and automate processes. Undergirding these technologies—and their insights and efficiencies—are means to produce, circulate, and use data. These data are explicitly captured by sensors and devices, as well as are produced a byproduct or as “exhaust” of various systems. Through analysis and application, data fuel smart cities by attuning systems and people to macro- and micro-processes previously too difficult or invisible to act upon.
Given the contested state of smart city data, we embarked on a project to understand what challenges and barriers exist to making legacy data machine-processable in the smart city. Rather than account for technical barriers in isolation, we engaged in constructive design research (a practice-based methodology) to understand the cascade of dependencies embedded within data wrangling. Focused on budget data in the City of Atlanta—a prime example of legacy data ripe for transformation into machine-processable OGD—we wrangled these data into structured data files. In particular, we created Google spreadsheets of budget data from 1996 to 2017 able to be exported to various structured formats (.XSLX, .CSV, .TSV). Driving the production of these data files was the comparison of budgeted revenues and expenses to audited (“actual”) revenues and expenses.
This project was motivated by the following research question: what assumptions, barriers, and challenges exist within the sociotechnical practice of wrangling legacy data in the smart city? Put differently: what does data wrangling mean in the context of the smart city beyond the technical extraction, manipulation, and transformation of data? Through this practiced-based approach, we learned that machine-processable OGD depend on an array of coordinated features in the smart city landscape, from where data is hosted and how it is documented to the embedded values of opening data and the tacit domain knowledge of data production.
In this blogpost, we give an overview of the insights from the legacy data project. A more detailed analysis will be available in a forthcoming whitepaper on the project.
The Scarcity of Machine-Processable OGD
Our research was framed by this following provocation:
If data are so vital to the smart city project, why are data so scarce?
Where there seems to be a glut of proprietary, closed data—that is, data that some entity has exclusive control over (e.g. data that can be sold, and access and use can be restricted; see Tauberer 2014 for more)—other types of data are more rare. In particular, the data that seems to be lacking are machine-processable open government data. Open government data—or OGD—refers to “non-privacy-restricted and non-confidential data which is [sic] produced with public money and made available without any restrictions on its use or distribution.” (Janssen et al. 2012 p.258) As such, OGD are data that are produced by and about governments, citizens, and businesses in their public capacities. Machine-processable data are data “reasonably structured to allow automated processing”(Open Government Working Group 2007, 2014). The Sunlight Foundation’s Open Data Policy Guidelines explain that machine-processable data are “[o]ne step beyond machine-readable data” by existing in “a format intended to ease machine searching and sorting processes.” As such, machine-processable OGD are vital to understanding public processes, transactions, and affairs. Without these data, a host of potential insights and avenues promised by the smart city are non-starters.
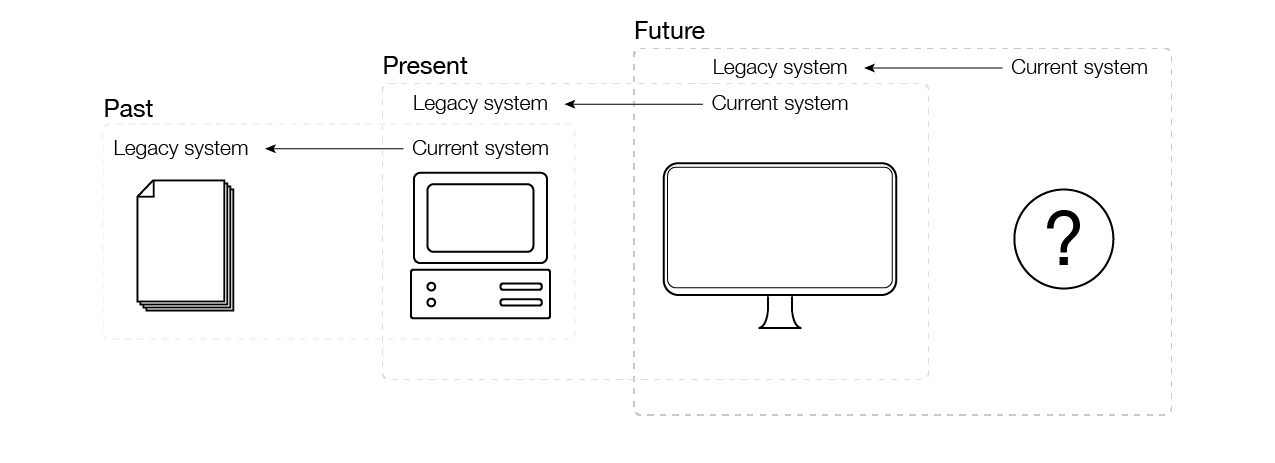
One major challenge for the machine processability of OGD is the speed and character of technological change. Simply put, machine processability is not a static state. As anyone who has ever moved between two different computers knows, the ability to use files of varying formats depends on an entire system. Governments are slow to overhaul information technology (IT) systems and smart city technologies (platforms, standards, systems) seemingly change from day-to-day. The disparity in the pace of change means that governments adhere to a configuration of aging, obsolete, or outdated protocols, procedures, and infrastructures of data production, circulation, and use. We define this configuration as a legacy system. As such, these legacy systems produce data—namely, legacy data—that fail to be easily integrated into new smart city systems, and therefore are not machine-processable, even if they are open-access or publicly available.
In an effort to catalog the state of OGD in the United States, the Sunlight Foundation launched the US Open Data Census website in 2014 in partnership Code for America and Open Knowledge International. Through hackathon-like events as well as ongoing assessment, the US Open Data Census provides resources to evaluate the availability of city-level OGD based on nine criteria: whether data exists, is openly licensed, freely available, machine-readable, available in bulk, regularly updated, publicly available, online, and in a digital form. The results highlight the scale of the challenge facing machine-processable OGD. Of the 1111 currently identified datasets across 101 US cities, only 627 (56%) are machine-readable. Similarly, only 601 (54%) datasets are downloadable in bulk. Even fewer—only 552 (50%)—are both machine-readable and downloadable in bulk. Though not equivalent to machine processability, the US Open Data Census reports that only 37% of public datasets in the US are, in fact, open. Ultimately, the machine processability of these data depends on the fulfillment of most, if not all, of these criteria. Even more, the percentage of total datasets that are actually machine-processable is likely to be even lower than the US Open Data Census might indicate because these percentages are based on cities that have local volunteers willing to sort through the available public data. Furthermore, the leading cities—San Francisco, Las Vegas, New York City, Chicago, and Austin—represent highly resourced municipal governments, indicating that machine-processable OGD are concentrated within cities with highly skilled labor pools and dedicated resources. Put in perspective, in 2012, the US Census Bureau reported that there were 19519 municipal governments in the United States. The 101 cities in the US Open Data Census, then, represent a 0.5% of all municipal governments. As such, machine-processable OGD are far less common than one might assume.
Looking at a different portal highlights an adjacent issue. Data.Gov is a federal open data portal with 195422 datasets. 16411 of these datasets correspond to the topic of local government, and only 6594 are actually produced by city governments. About 25% of these city-produced datasets come from New York City alone (1706 datasets). Atlanta—ranked 24th in the US Open Data Census—has no datasets on Data.Gov. This indicates that data scarcity can stem platform dependencies related to patterns of use. New York City is clearly highly invested in pushing datasets to Data.Gov, where the City of Atlanta is clearly not. In this platform, data are limited by those cities aware that the platform exists at all.
One way to make OGD machine-processable is to migrate a legacy system to a newer system. Yet where new solutions that expand a city’s capacity are met with enthusiastic support, upgrading existing systems often are not. The cost of upgrading IT tends to be difficult to justify. Existing legacy systems often still work for their given purpose, even if these systems are on the verge of obsolescence. Even more, migrating a legacy system remedies only a part of the problem. The other part is transforming the data themselves to be integrated into an entirely new set of protocols, procedures, and infrastructures. This process is referred to as data wrangling (alternately called data munging), or the process of making data useful for a given end. In the smart city, usefulness means machine processability. Therefore, the goal is to transform OGD into appropriate structured formats. Although these two processes—migrating systems and wrangling data—are related, they are distinct, each of which presents challenges. As already mentioned, overcoming scarcity is as much an issue of using the right platforms as the format of the files.
But legacy data are more than old files. Changing IT requires retraining personnel, restructuring administrative procedures, and reformatting what data are collected, stored, and accessed. In this way, governments (and many organizations) are slow—technological change implies changes in long-established and deeply entrenched administrative practices, usage expectations, and host of other social factors. As such, the challenge of legacy data for smart cities precedes computerized systems and extend beyond the immediate reach of such systems. In short, making legacy data into machine-processable OGD require more than a technical fix.
The follow sections overview the insights from this research.
Insight 1: Domain Knowledge is Important to Data Wrangling
Although budgets are orderly documents, as a dataset, they are complicated. In part, this complexity comes from subtle yet important distinctions about what a budget actually is. In order to explain what we mean we need to explain how budget documents are made.
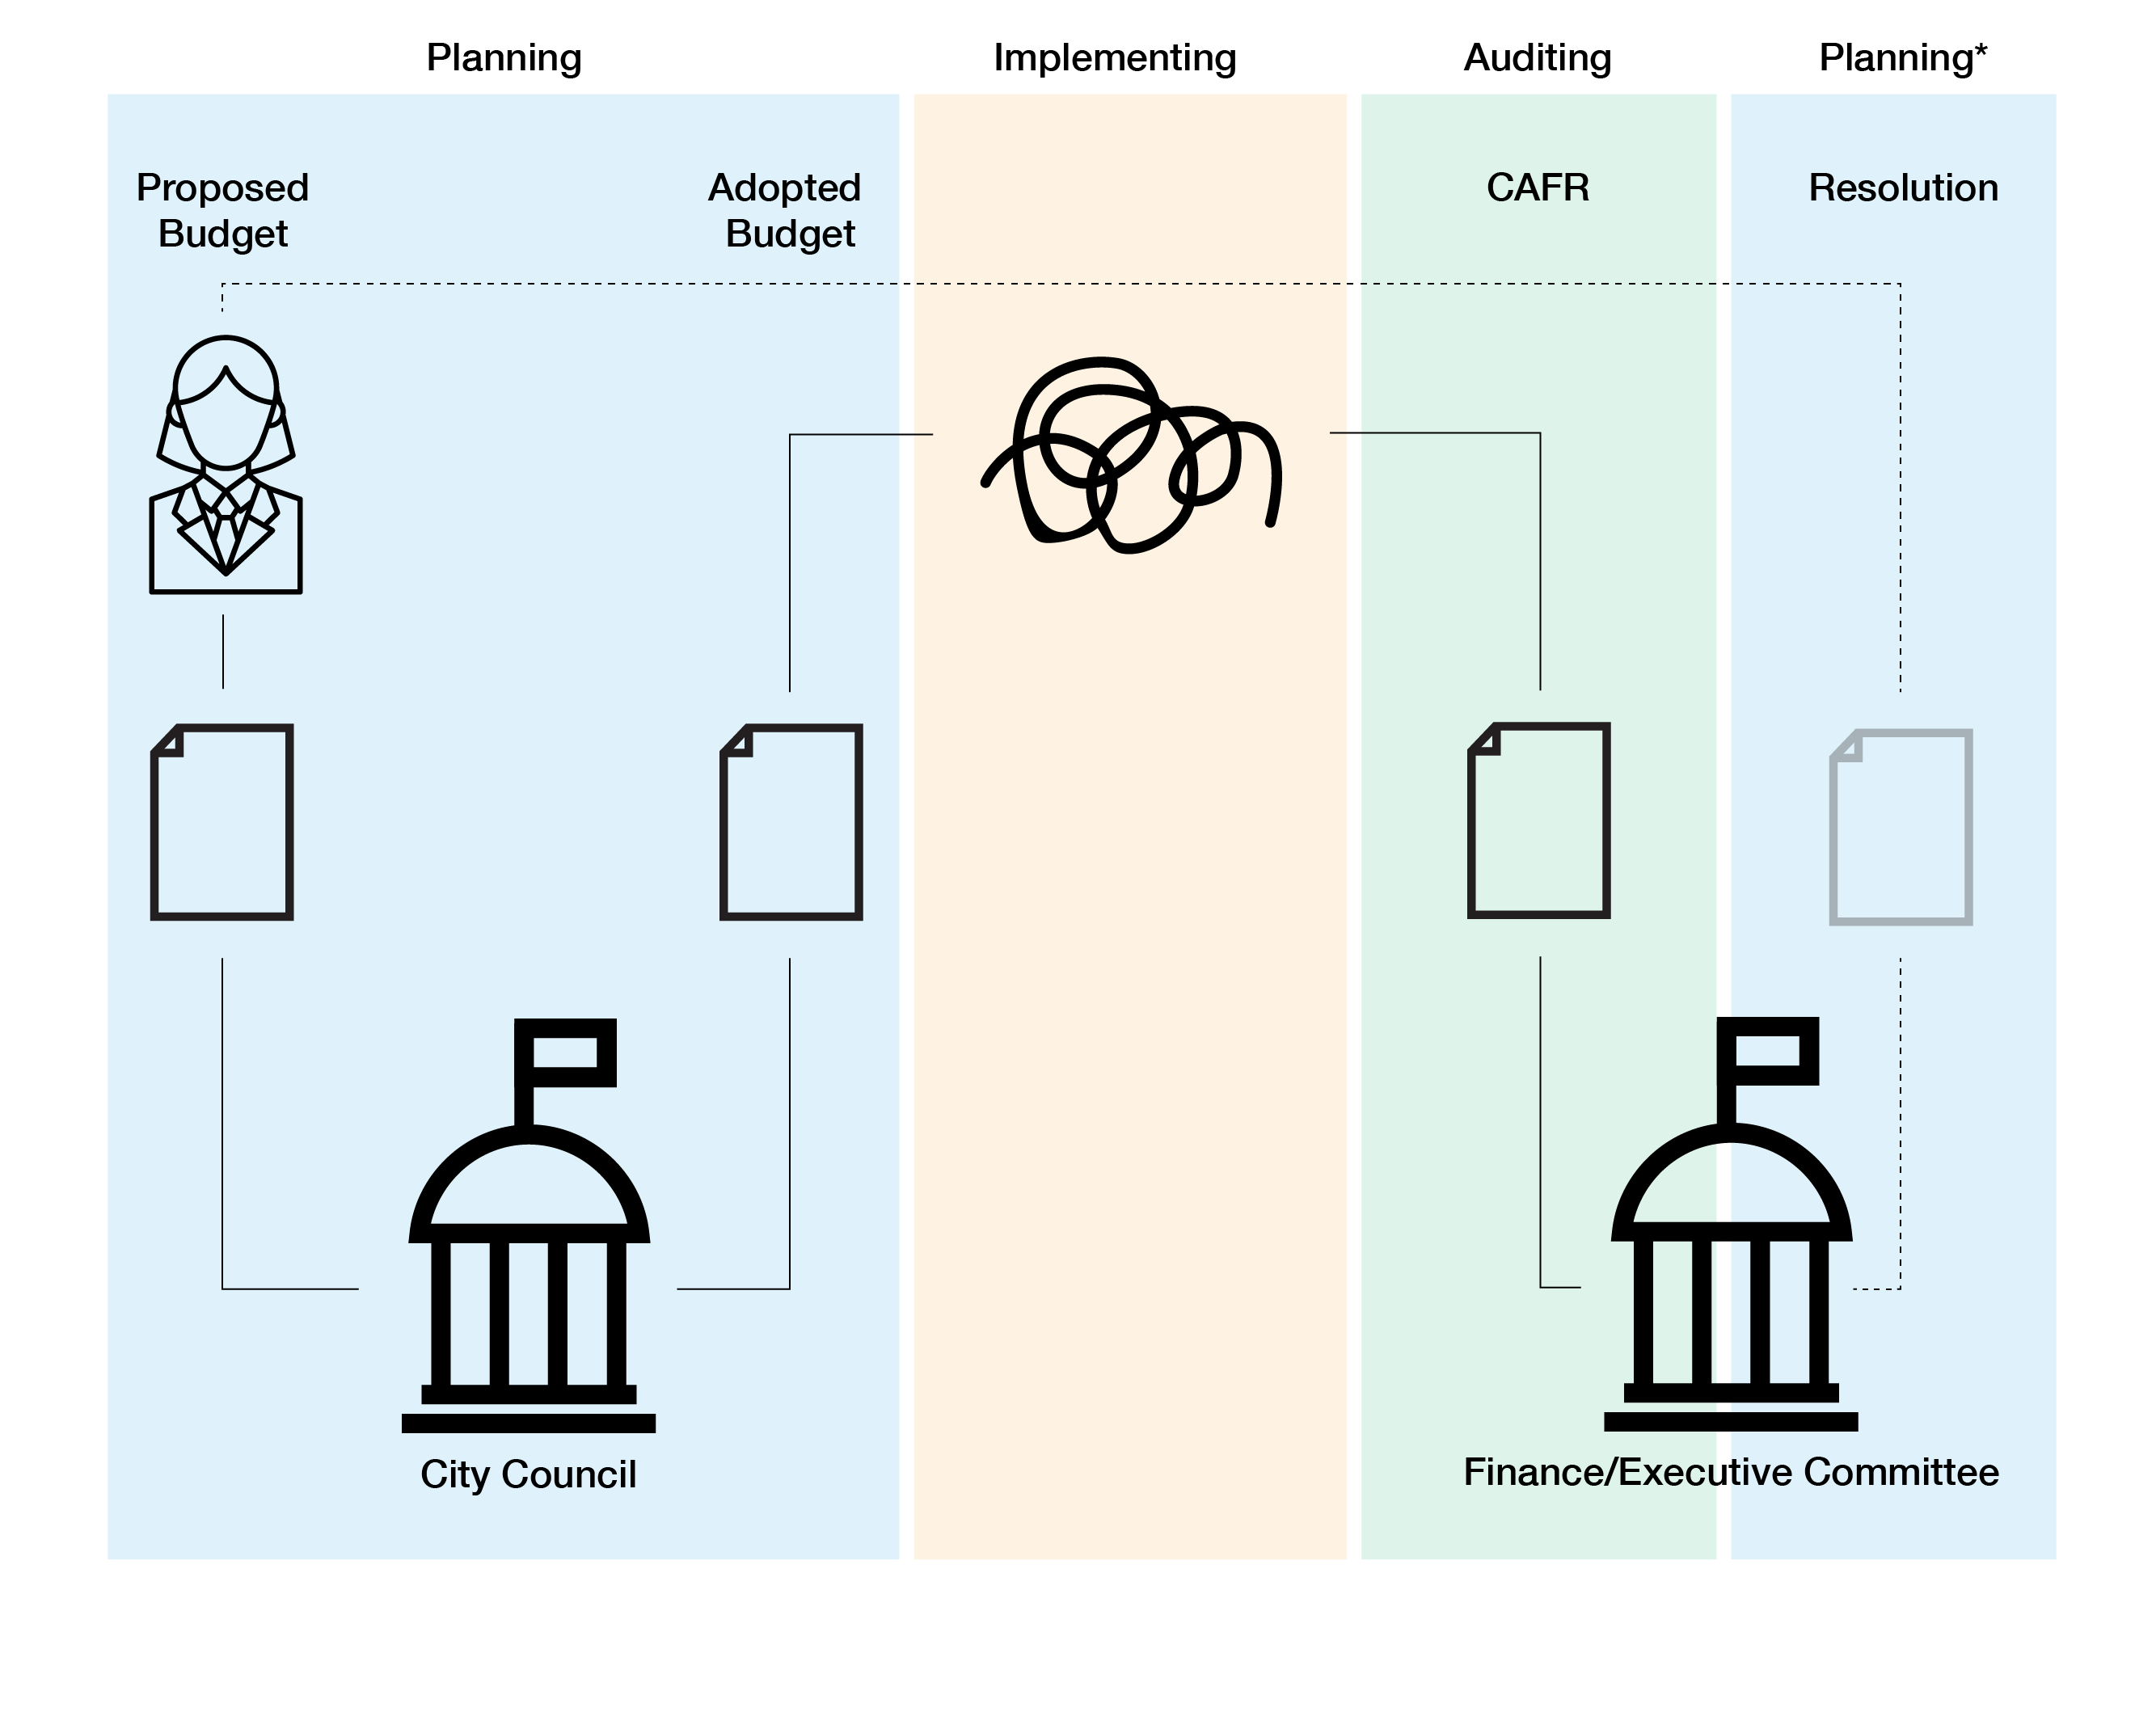
The City of Atlanta budget process follows the production of three primary documents. The first document is the proposed budget, which is created by May in preparation for the upcoming fiscal year (July to June). This document is created by the Office of the Mayor, and takes into consideration the priorities submitted by Atlanta City Council’s Finance/Executive Committee in a nonbinding resolution. The second document is the adopted budget. The adopted budget is created out of the debates and negotiations of full City Council with regards to the proposed budget. By the end of June, the City Council must adopt the budget. The third document is the comprehensive annual financial report (CAFR). This document is created at the close of the fiscal year and reports the audited expenses and revenues of Atlanta’s city government. The CAFR is then used to help set priorities in the subsequent fiscal year. (See Figure 1 for a diagram of the process.)
In many ways, the process of producing these three documents—the proposed budget, the adopted budget, and the CAFR—are split. The first two documents are documents that look forward; the latter document looks backward. As such, the proposed and adopted budgets are truly budgeting documents in that they estimate expenses and revenues. In other words, budgeting is a type of planning. The CAFR, on the other hand, is an auditing document in that it is an inspection of the accounts and activities. Between planning and auditing, commitments are implemented as revenue is generated and expenses are deducted over the course of a fiscal year (and all that can happen in any given year). Although the CAFR provides data on the actual expenses and revenue, these data are not, say, higher fidelity than proposed or adopted budget data, but instead refer to different processes altogether. That is to say, the data enclosed in these different documents have continuity, but are not the same. The proposed and adopted budget data are data about projections, and so constitute promises made by civil servants and elected representatives to the public (the Mayor and City Council in the proposed and adopted budgets, respectively). The CAFR, on the other hand, is an account of whether and to what degree these projections and promises were met. Without marking this distinction, one could confuse value of these different documents and the usefulness of the different data.
In order to make budget and audit data useful, one must first understand what types of evidence these data might produce. Where machine processability is the default technical goal of wrangling OGD within the smart city, machine processability must be coupled with data that are meaningful and understandable to those seeking new insights. Before engaging in any process of wrangling, what is being wrangled must be understood. In the case of budget data, the production of these three documents impacts what types of insights one might gain. This is but one instance where domain knowledge became important to the data wrangling process as we will see in the next section. Other instances—such as the shift from a January-to-December fiscal year to a July-to-June in 2007 (see below)—impacted what and how we collected, extracted, normalized, and documented the data.
Insight 2: Wrangling begins with collection
In order to transform data into a machine-processable format, you must first have data. As such, our initial step in wrangling data was collecting files to establish the data corpus. The data corpus constitutes the known extent of the data relevant to a particular topic (here, Atlanta’s revenues and expenses). But collection is ultimately driven by what we are interested in understanding through data. In this way, collection is always oriented toward a question answerable with data. Motivating our project was a comparative question: how well do budgeted revenues and expenses compare with audited (actual) revenues and expenses? From this question, the data corpus becomes actionable.
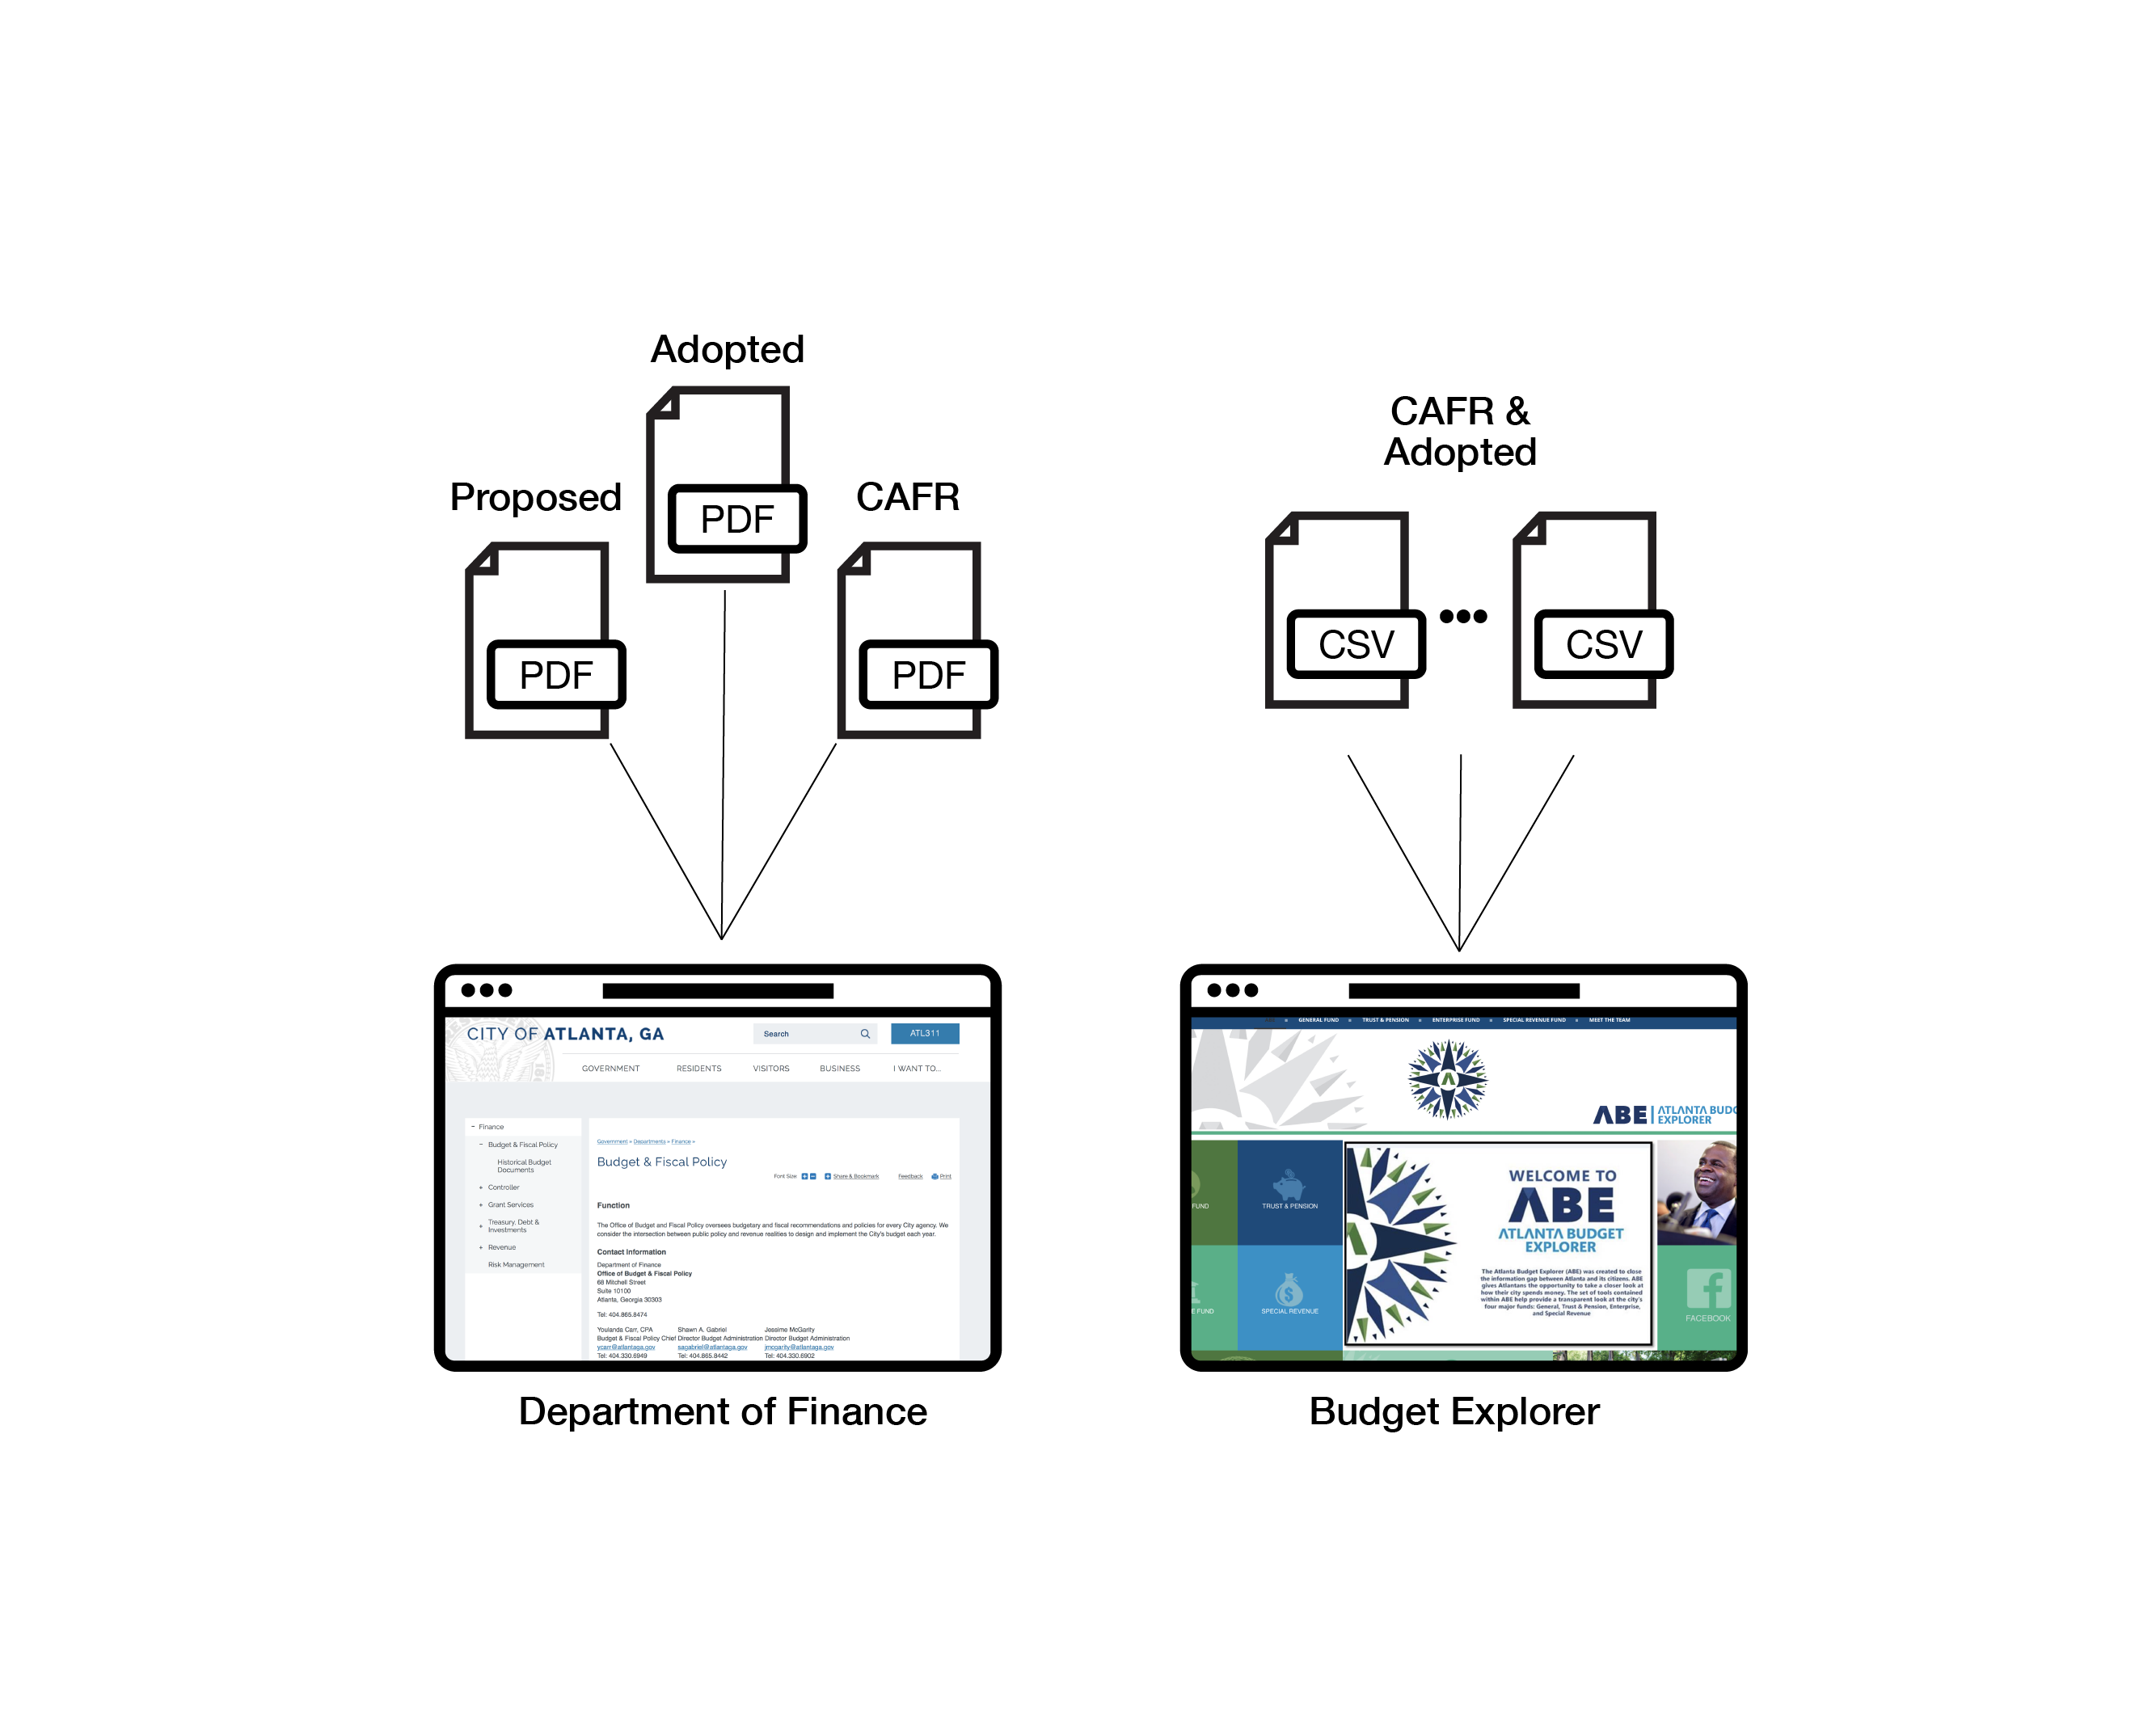
Managed by the Department of Finance, expense and revenue data are released through two channels (see figure 2). The first channel is the Department of Finance webpages located on the City of Atlanta website. On these webpages, budget data are available in portable document formats (PDFs). The data are released in different discrete documents that must be downloaded individually. Proposed budgets and adopted budgets are released on the Budget and Fiscal Policy subpage. Currently, these documents can be downloaded dating from 2010-2018. Also available on this subpage are monthly financial reports from fiscal year 2010 to December of fiscal year 2017, and five-year financial planning documents from fiscal year 2011 to 2018. Adopted budgets (“budget books”) dating back to 1996 can be downloaded on the Historical Budget Documents sub-subpage. Auditing documents are found on the Controller subpage. This subpage contains both digest documents of the City’s performance (Popular Annual Financial Reports or PAFRs) from 2012 to 2016, and the more detailed CAFR documents from 2002 to 2016.
The second channel for expense and revenue data is the Atlanta Budget Explorer (ABE) website, a visualization of expense and revenue data hosted by the City of Atlanta and built with Tableau. Conceived during the 2nd annual Govathon in 2013, the ABE is designed to show Atlantans how and where Atlanta city government spends and generates money. The ABE provides information on four of the City’s major funds: General Fund, Trust and Pension, Enterprise Fund, and Service Revenue Fund. The underlying data on the site are primarily derived from the CAFR. Currently “actual” revenue and expenses are available for 2012 to 2016. Expected revenue and expenses—i.e. budget data—are derived from the adopted budgets for 2017 and 2018. A collated dataset is downloadable from within the ABE as a Tableau worksheet, PDF, Excel file (XLS), CSV, or image (PNG of a visualization). The available data files are individually downloadable based on the particular visualization of funds and departments, and are not able to be bulk downloaded on this or any other site.
As already mentioned, confusing budget data and auditing data presents a problem from the perspective of the kinds of questions one can answer with data. In particular, the ABE presents data that seems to answer the question “where has money actually gone/come from?” The question that motivates our research is “how well does the City of Atlanta budget?” This second question requires the comparison of budget data and auditing data.
As for the process of wrangling, collection reveals the extent of the task and where to focus efforts. With the data from the ABE being primarily auditing data, we realized the data corpus greatly exceeded the existing machine-processable OGD found within the ABE. Instead, the various PDF documents adopted and proposed budgets housed the data we were after. Given the absence of these data in machine-processable formats, the PDF files became the primary subset of the data corpus and clearly defined our next steps in extracting, schematizing, and documenting the data. Additionally, with the question of comparing budgeted values for expenses and revenues with their audited counterparts, we focused on the adopted budgets rather than proposed budgets because adopted budgets represent the combined priorities of both the Mayor and City Council. (Again, domain knowledge matters!)
To reiterate, data wrangling means making data useful, and being useful is dependent on the context of use. Where collection seems exterior to the manipulation and transformation processes defined by data wrangling, collection is vital to establishing the context in which a particular question is answerable through data.
Insight 3: Extraction requires synthesis (and/or why automation may not help)
A primary task within legacy data wrangling is extracting data. Extraction entails pulling data from one file into another file for the purposes of further cleaning, ordering, and (re)formatting. In the context of legacy data generally—and specifically with our project—extraction can be a time-consuming, manual process. In terms of time spent, extraction dominated our project work. Where automation may help, it can also compromise data quality and obfuscate telling idiosyncrasies within the data.
Synthesis, on the other hand, is the process of creating data, either through calculations or other manipulations performed on data. In many ways, extraction and synthesis seem to be opposing processes. Extraction being rote translation from one file to another and synthesis being active creation and manipulation. Yet, as we found, extraction and synthesis are sometimes simultaneous in order to produce a data file that are meaningful and complete.
Targeting only adopted budgets, we began to comb through these documents dating from 1996 to 2017. The first challenge was that the quality of the PDFs changes dramatically across the corpus. Newer PDFs were created digitally and so were already searchable. This feature allowed us to easily locate specific funds and line items. Older PDFs, however, were scanning paper documents, and therefore not immediately searchable. Rather than look through these documents completely manually—meaning, visually line-by-line—we performed optical text recognition (OCR). Due to the font and visual artifacts produced from the original scan, OCR was only partially successful. As such, searching older adopted budgets requires us to perform a second manual pass to confirm no data were missed.
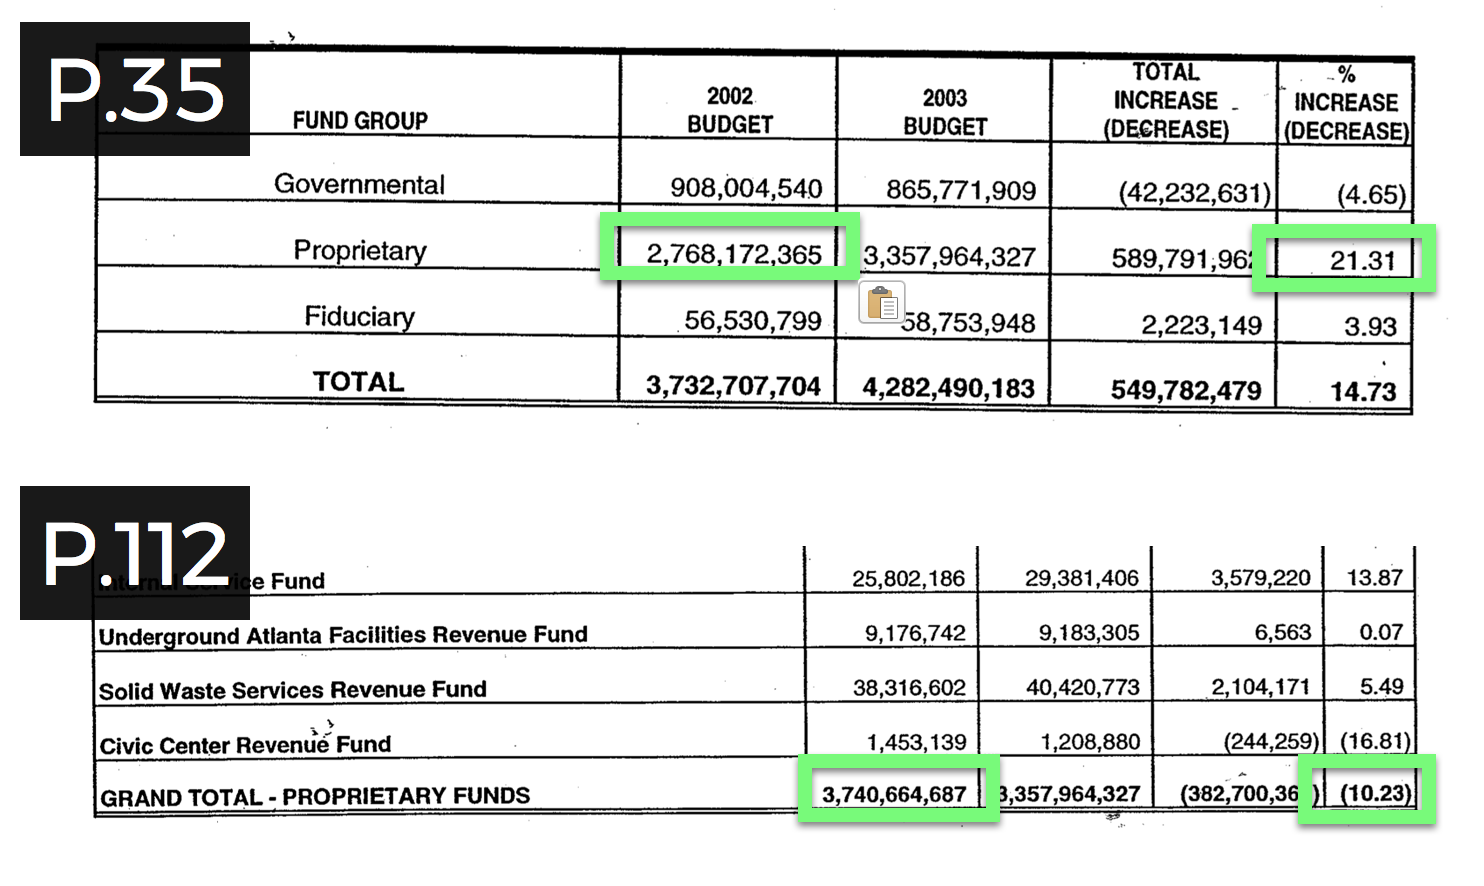
The next challenge was that adopted budget documents are created by humans and therefore contain errors. For example, in the 2003 adopted budget, two different values were used for the total value of the 2002 Proprietary Funds—$2,768,172,365 on page 35 and $3,740,664,687 on page 112 (see figure 3). Upon checking the value against other documents, the latter value appears to be a typo. The question is how should we account for this discrepancy in our data file? For this particular cell we recorded the verified value ($2,768,172,365 from page 35) but also to produced cell-level metadata that cites the page number of the source and notes the error in the original document. This strategy was extended to all cells in our data set to account for our own potential for producing human error through data entry and allow for others to inspect our process. In this way, the extracted data are accompanied with a map of how the data was extracted in the form of transformational metadata in order to inform users of the data about why a specific value is listed. Here extraction itself synthesized (meta)data.
A third challenge for extraction—and one that also impacted and stemmed from schematization and normalization (see the next section)—was how funds changed over time. As such, certain summary values of particular funds were not always listed in the document. In some instances, these values needed to be calculated, such as the change (in percentage) from one year to the next of a particular fund. In other instances, funds that did not exist or no longer existed required a designation that distinguished amongst non-numeric entries. We created a system to distinguish amongst funds that had no mention in a particular document (marked with “NM”), values that were pending (e.g. audited values for future years [marked with “FY”], or documents yet-to-be-reviewed [marked with “TBD”]), and values required calculation (e.g. summations of funds; marked with “CALC”). Here again, extraction requires synthesis as this classification scheme distinguished cells with a zero (i.e. a listed value of zero) from empty values.
Reflecting on these challenges reveals that automating extraction, although certainly time saving, may jeopardize data quality both in terms of the veracity and the verifiability of the data. In the first case, automation does not account for errors in the data; in the second case, automation does not track the origins of extracted data. In both cases, poor data quality may undermine claims made with data, and compromise the usefulness of OGD.
Insight 4: Schematization and Normalization Are Iterative
Schematization refers to the creation of an organizational structure for data, both in terms of architecture (how data are ordered and arranged as a set) and entry (how an individual datum is recorded). Normalization refers to the standardization of data in light of inevitable variations across different schemata. These two processes create data such that they can be processed in systematized ways, whether that means being joined with other data sets, algorithmically analyzed, or some other machine process. We have already touched on normalization in the previous section with regards to distinguishing between types of empty cells.
Although these processes are central to all data, they are especially important to legacy data wrangling. Legacy data are defined by a change in the protocols, procedures, and infrastructures of data production, circulation, and use. These changes often—if not always—entail changes to the architecture of a dataset as well as the conventions of data entry and collection. Even more, given that legacy data may extend across a large timescale, the potential for multiple explicit and/or implicit changes to organizational and entry standards are possible. In the budget data corpus, this final point was certainly true.
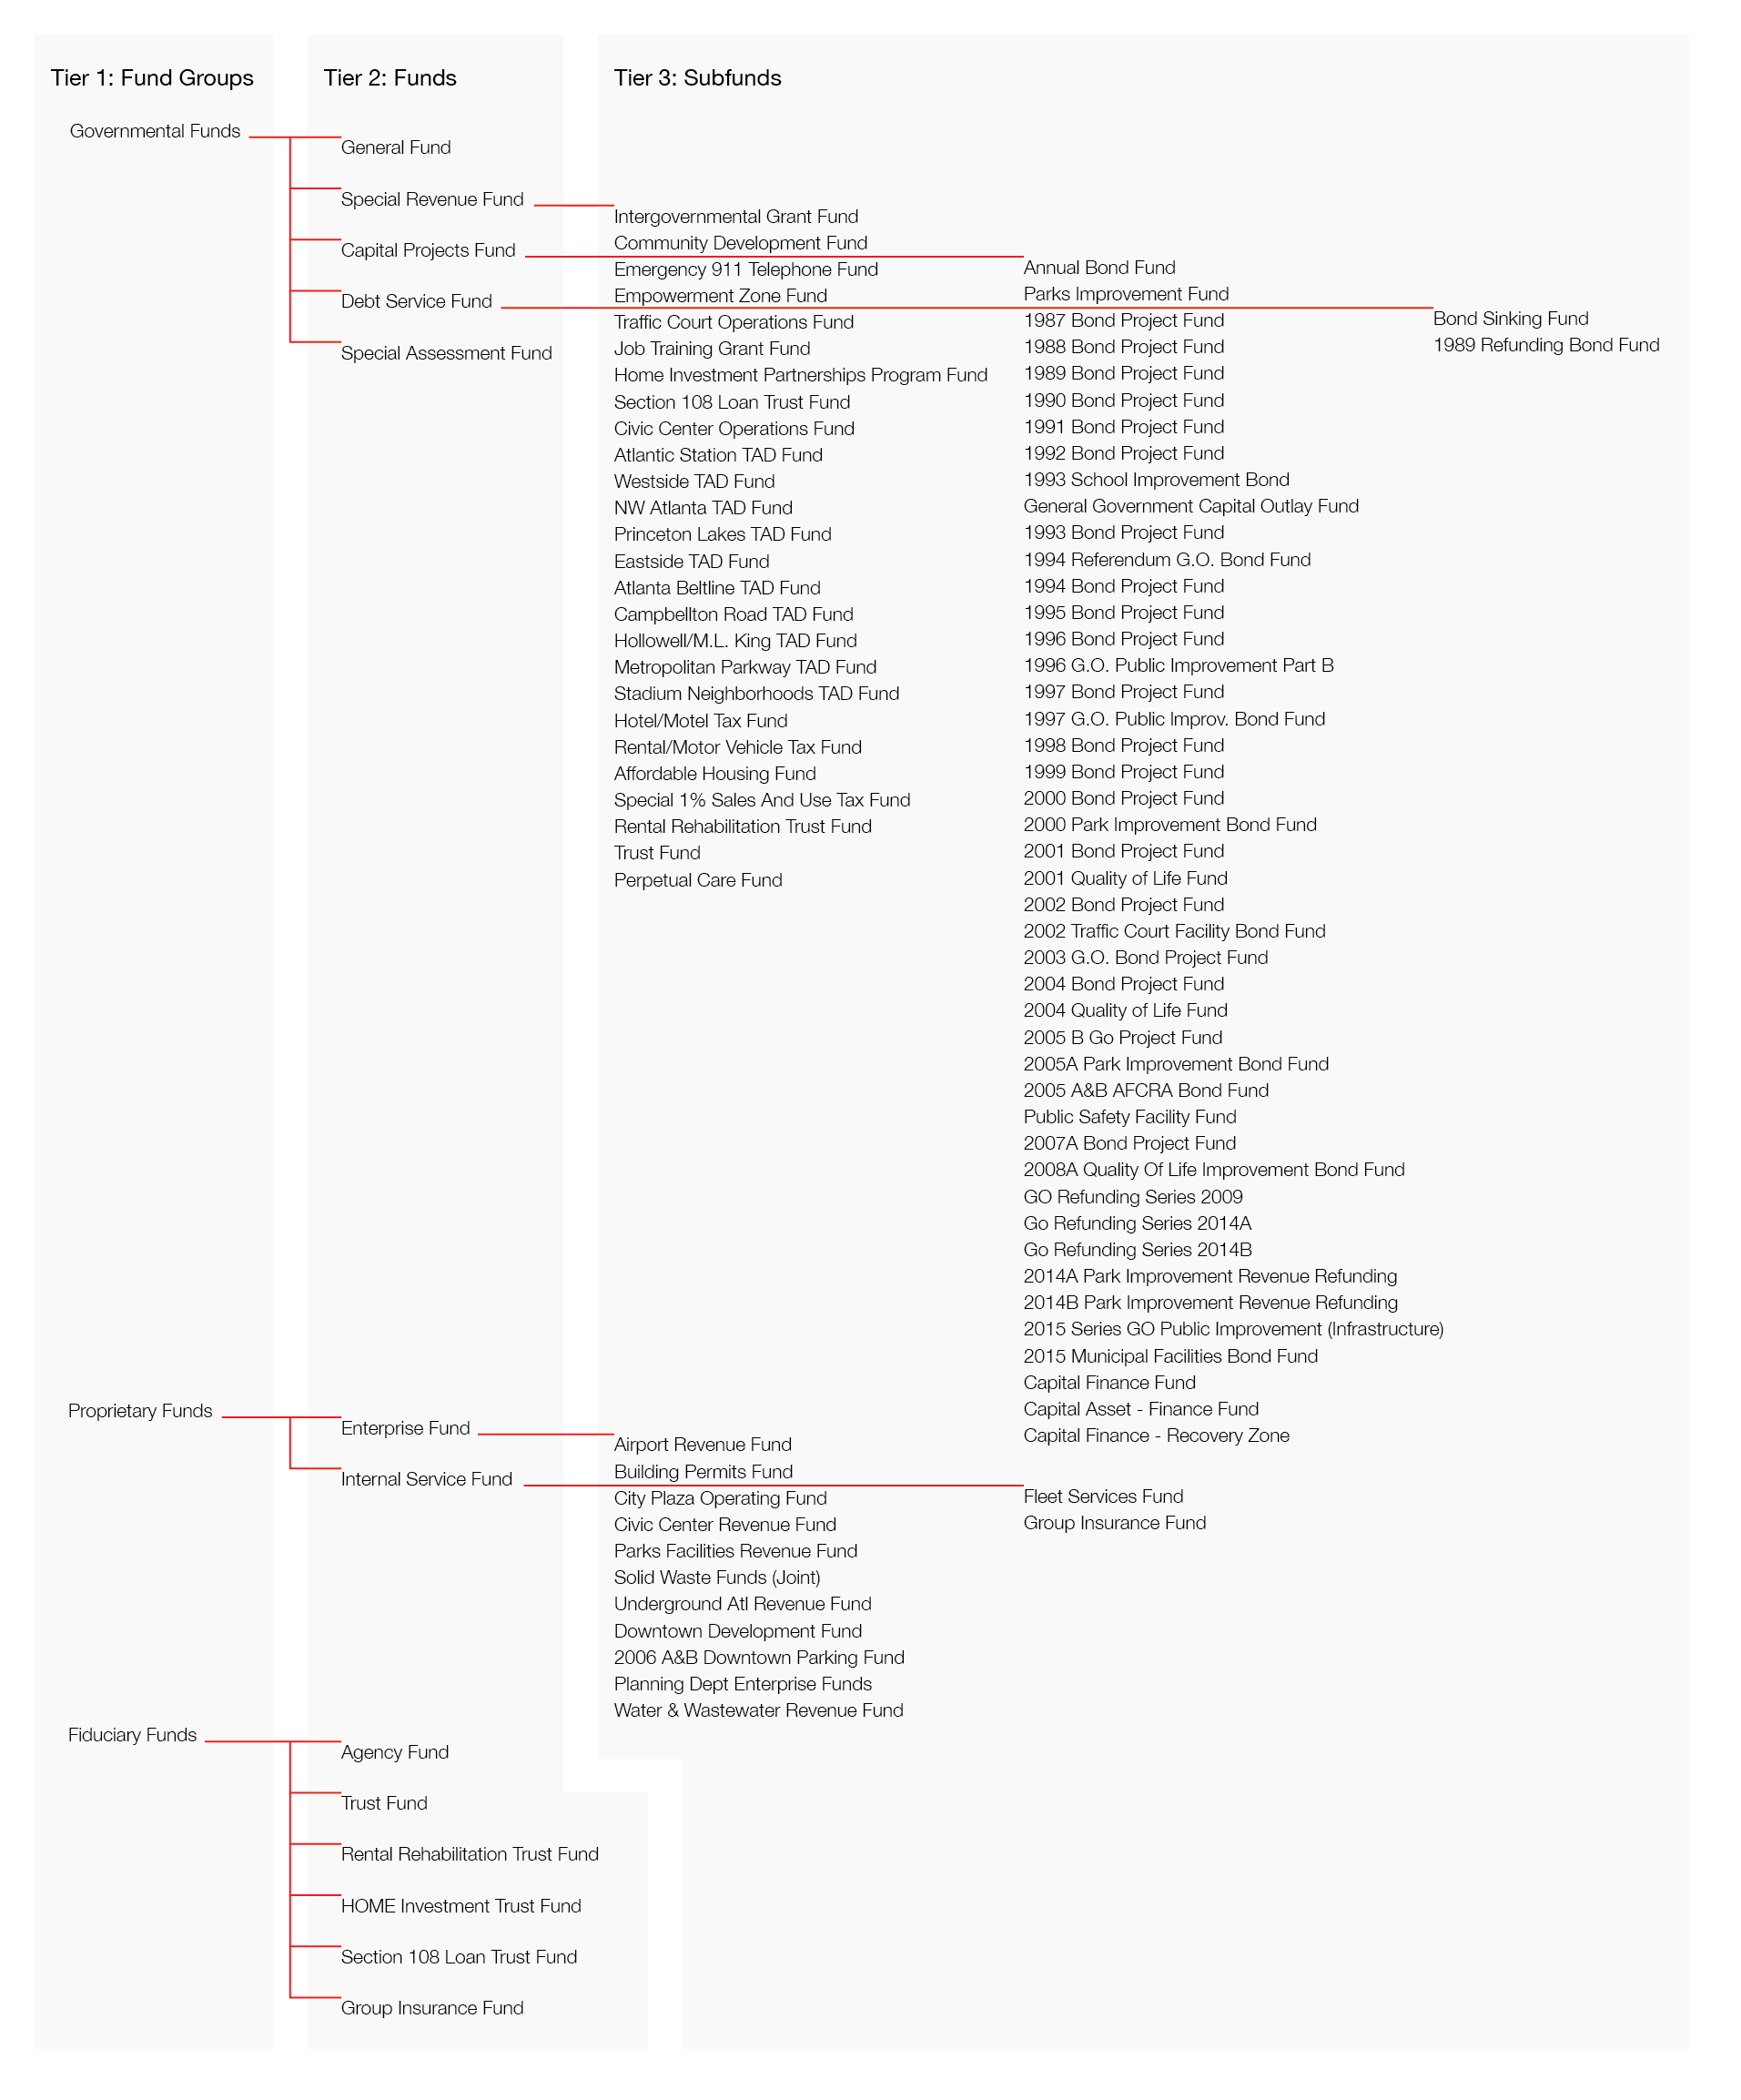
After collecting the corpus and deciding to focus on adopted budgets, we initially extracted data from sample of years (1996, 1998, 2003, 2008, 2012, 2017) to understand the organization of these files and discern an architecture. From these years, we determined an overarching organization, of which we adopted a three-tiered structure (see figure 4 for details). The first tier are fund groups, or groupings of revenue and expenses based on how the money is procured and can be used. These fund groups are Governmental Funds (funds supported by taxes, grants, special revenue, and other sources), Proprietary Funds (funds related to operations and revenues from governmental services), and Fiduciary Funds (funds held in trusts or unable to support governmental activities, e.g. pensions). The second tier are funds, or allotments of money allocated to particular functions, such as the General Fund (money for departmental operations) or Special Revenue Fund (money for specific projects). The third tier are subfunds, or alloments of money for specific purposes, such as the Intergovernmental Grants Fund within the Special Revenue Fund.
Although this high-level architecture carries across the entire data corpus, variation within this framework required iteration on the specific elements. For example, between fiscal year 2013 and 2014, the Group Insurance Fund switched from Fiduciary Funds to Proprietary Funds, respectively. Where the Group Insurance Fund persisted across years in name, its funding sources changed and therefore it exists in two different fund groups. Even more, the shift changed the Group Insurance Fund from a subfund (Proprietary Funds > Internal Service Fund > Group Insurance (Sub)Fund) to a fund (Fiduciary Funds > Group Insurance Fund). In synthesizing data on the percent change between 2013 and 2014, we needed to annotate the data point with cell-level metadata. The annotation noted the change in where the fund was located as a caveat to the percentage change in the fund. At the organizational level, we decided to duplicate the fund name, thereby rendering the name of a given fund group, fund, or subfund no longer unique. This resulted in adding an additional unique identifier in a separate column. The unique identifier was necessary for machine processability as a data structure is most useful when it is well defined.
Another issue with regards to schematization arose from a shift in the timeframe represented by the data. In 2007, the fiscal year changed and was recorded in a one-page document found instead of a full budget for 2007. Budgets preceding 2006, adhere to a calendar fiscal year, spanning January to December. Budgets after 2007, adhere to a July-to-June fiscal year. As such, comparing budgets from 1996 to 2016 compares different timeframes, though still comparing fiscal years. In organizing data by year (columns correspond to documents from a given fiscal year), the current architecture obfuscates the change in what a fiscal year signifies. In this way, listing values by year make 1996 and 2016 comparable despite changes to their actual timeframe, thereby normalizing the data through schematization.
These different instances illustrate that schematization and normalization are an ongoing and iterative process. As data are added to a dataset, the organizational architecture, entry-level schemata, and processes of standardizing are tested. These new data reveal where the structures and standards are consistent, but also where modifications need to be made. Rather than indicating that the initial schemes and norms are incorrect, these iterative adjustments reveal that any schemes and norms depend on the scope and scale of the data. In order to make data machine-processable, one must adjust these structural features and standards to adhere to the specific demands of the machine process. Yet, adjustments require adequate documentation to reveal potentially obfuscated assumptions.
Insight 5: Documentation is not just about data but about process
Where data themselves can provide meaningful insights into phenomena, these insights depend on the quality of the data. Data quality stems to the granularity, collection method, frequency, and timeliness of the data in answering a particular research question. Some of these features of the data can be directly assessed from the dataset (e.g. granularity), but others—such as collection method, and when and by whom the data was produced—are only knowable through metadata. With a data corpus spanning many legacy systems, documentation standards often vary, leading to issues with verifying data quality.
Most often metadata provide valuable information about who, where, when, how, and occasionally why data are produced. According to Kitchin (2014), metadata fall into three categories: descriptive metadata, or data about what the dataset is called, what it includes, who produced it; structural metadata, or data about the organization and scope of the dataset; and, administrative metadata, or data about how the dataset was produced, including file format, ownership, and license. In our project we created metadata that describe the structure, collection methods, and contents of the dataset. In these files, we explain the ways the data changed over time (e.g. the fiscal year shift), the norms and schemes for ordering the data (e.g. how unique identifiers work and the descriptions of the tiered structure), and where the data came from (e.g. what files are sources and where those files came from). Even with all of these metadata, still some aspects of the data production were missing.
Extracting and synthesizing required us to account for the particular page(s) where a datum was found. These annotations allowed us to document where we found errors or typos. Additionally, tracking where a datum came from offered a means for us to mitigate the introduction of our own errors through a transparent process. These cell-level (or entry-level) annotations constitute a fourth category of metadata—transformational metadata. These metadata track the actions taken to create a particular value or file. At this very granular level, metadata aid data quality by revealing the original source material (page numbers of where a value comes from), including errors, typos, and annotations about different synthesized values. These metadata offer insight into how the dataset was produced; that is, transformational metadata are data about wrangling itself.
In the case of legacy data, transformational metadata are vital. With a host of potential variations, artifacts, and even errors from different legacy systems, documenting how legacy data were wrangled allows data analysts and researchers to inspect data production. By doing so, the process becomes data that can be analyzed and verified.
Conclusion
Our project sought to answer what assumptions, barriers, and challenges exist within the sociotechnical practice of wrangling legacy data in the smart city? These five insights provide a series of conclusions about the pressing challenges for smart cities.
-
Questions Drive Data: Although many claim open data hold nearly limitless insights, the project highlights that these insights are only as good as the questions being asked of data. Without a clear understanding of how data are useful for a given end, efforts to open data are more than likely to be aimless, reinforcing foregone conclusions rather than producing new insights. Even more, collecting data because they exist undermines the relationship between data and conclusions by confusing exploratory research with descriptive research. As such, being explicit about the questions driving the production of machine-processable OGD attunes conclusions and fosters different questions, thereby motivating data release.
-
Internal Capacity/Knowledge Cannot Be Overlooked: With increased emphasis on public-private partnerships, or city-university partnerships, or even subcontracting, smart cities projects are often accomplished through the extension of local government capacity through a contractual relationship. As such, local governments may be missing out on driving the agenda of smart cities by not developing internal capacity. Where companies can move fast, governments move slow, and slowness can be an asset when it comes to institutional memory related to the particular governmental context. For smart cities to thrive, change—technological or otherwise—needs to be paired with a long-term strategy. Local governments can to be the bearers of that strategy and can only do so effectively by building internal capacity and knowledge to establish appropriate resources (or leverage existing resources), develop new programs and projects, and negotiate contracts that align internal best practices.
-
Prepare for Change with Interoperability: The value of smart cities is derived from the comprehensive and integrated array of technologies and processes. With so much flux, taking a long-view on change is important. This long-view prepares for change by assuming no project, system, or dataset exists in isolation. Where companies sometimes (maybe often) push proprietary systems, local governments can push back and think about data ownership and governance in the terms of a different timescale. Here again, internal capacity and knowledge are vital. OGD are only a portion of the data landscape of a smart city. Open data, more generally, decouples data from systems. Although not always possible, establishing open data standards for all systems makes migration from one system to another easier by establishing an expectation of interoperability. Additionally, establishing open data standards also establishes administrative practices for wrangling data by creating expectations that data and systems require different attention and skills.
-
The Smart City is the Documented City: If data are the fuel of the smart city, then metadata are the pipeline and logistics network. To foster insights from data, local governments need to set standards for not just the release of data, but the adequate documentation of data. Documentation allows smart cities to learn from their past rather than just react to the present.