Flexible Work, Flexible Work Spaces: The Emergence of the Coworking Industry in US Cities
The following writing originally appeared on the Center for Urban Innovation blog and was co-authored with CUI director Jennifer Clark.
–
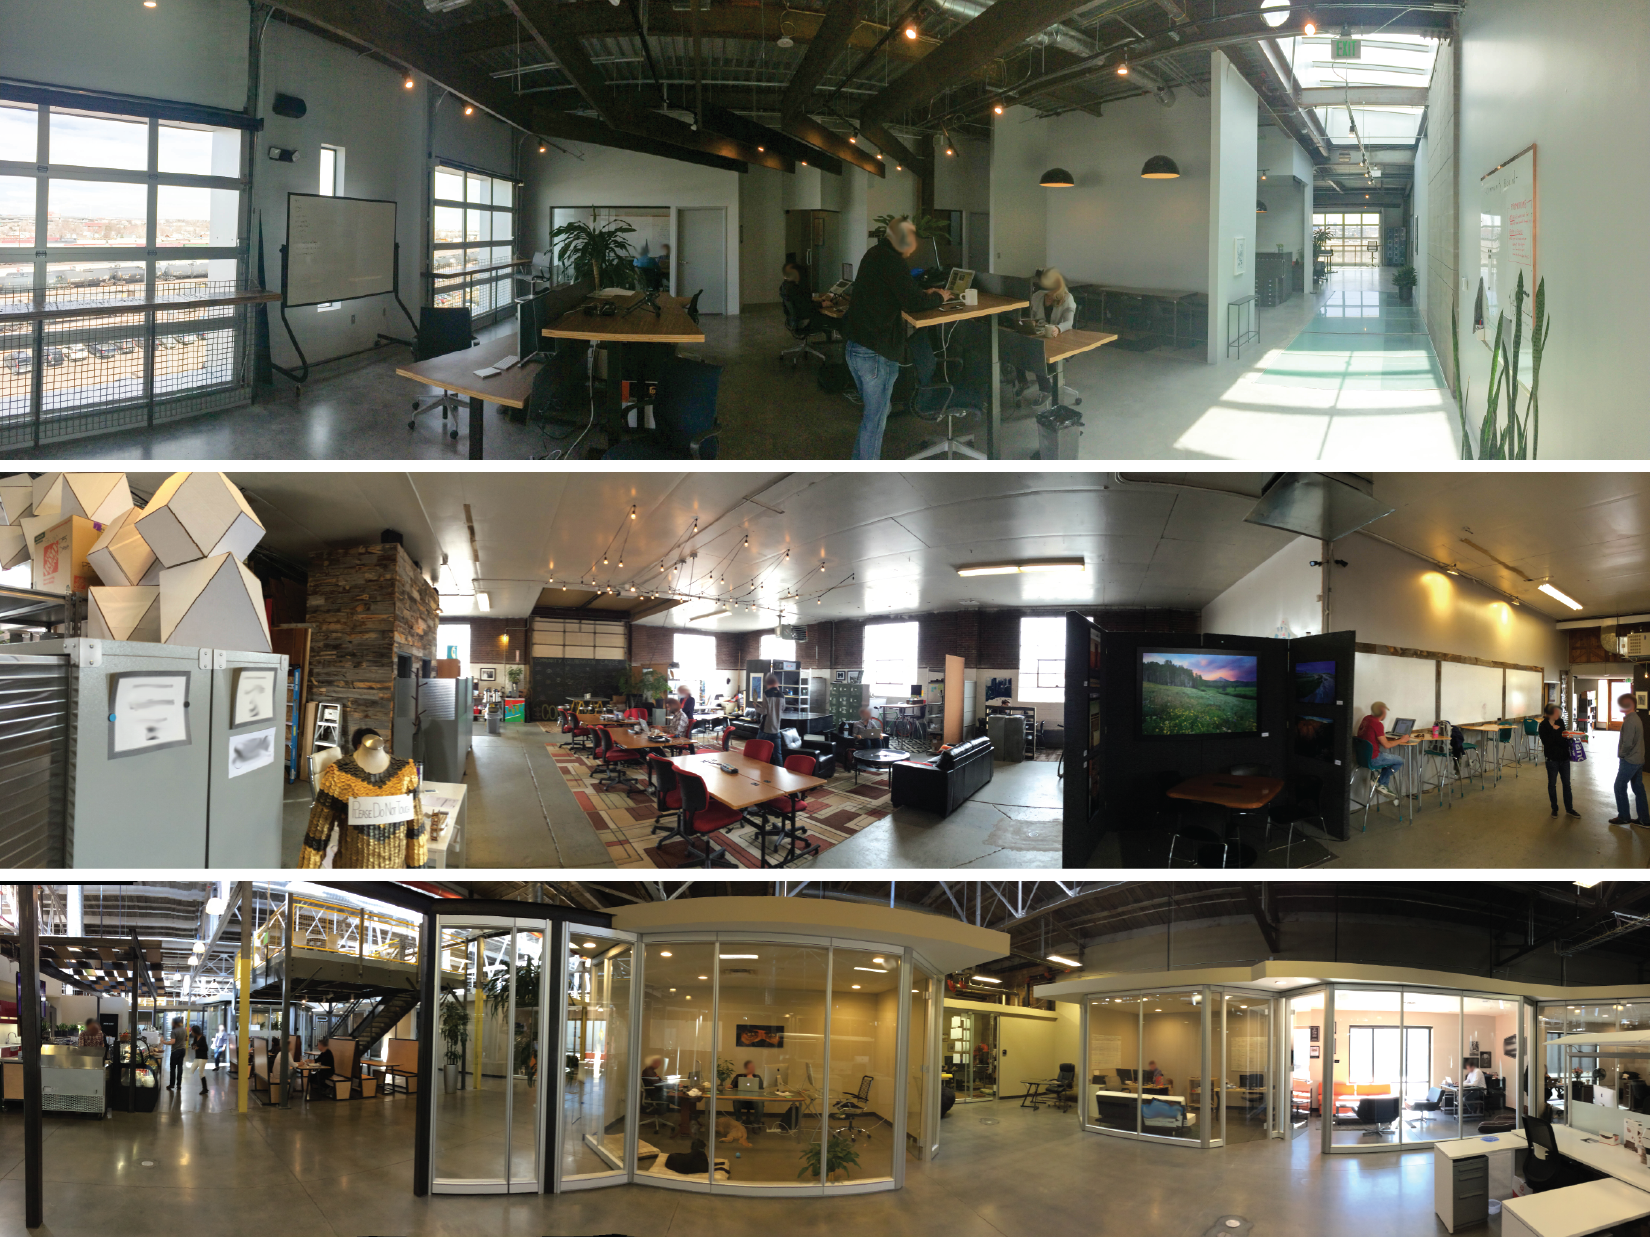
It is well established that flexible labor markets have changed work practices in the US. However, much less is known about how flexible work practices have produced and are producing flexible workspaces. Our research on coworking spaces illustrates how labor market flexibility has not only defined new employment practices but also created an emerging industry of coworking firms that provide workspaces — and workplace services — to a growing cohort of American workers for whom flexibility is a occupational norm rather than an occasional career condition.
Since the 1980s, economic geographers and industrial and labor relations scholars have documented how flexible work practices led to the reorganization of external and internal labor markets, redistribution of work processes, and renegotiation of employment regulations. These changes have affected how firms make strategic decisions about the spatial division of labor within the firm and how they deploy localized assets (work spaces) to manage an increasingly flexible workforce.
In our research we have constructed a database of 662 active coworking spaces within the continental United States. From this sample, we analyzed the spatial distribution of coworking firms across the US. From the set of 662 coworking spaces, we then created a geographically proportional subsample of 116 spaces to research more detailed information on the offerings, business models, and characteristics of coworking firms. Below we report our initial empirical findings.
Defining Coworking
First, defining coworking firms has been an empirical challenge for researchers. In an early study, Clay Spinuzzi argued that coworking — as a space — physicalizes the community and professional network many workers have been missing as freelancers, small business owners, and remote or contract workers. Here, we shift the approach to look at coworking through economic terms and focus on what coworking firms provide users. In other words, we define coworking firms by how and in what ways they commodify workspace as a service. The table below defines the four key value propositions we identified through our analysis of the firms in our dataset: 1) Space-as-a-Service; 2) Community, 3) Professional Network, and 4) Work-Life Balance. In our research, 100 percent of coworking firms provided 1) Space as a Service and 95 percent of coworking firms provided 2) Community. As a consequence we consider these two value propositions defining characteristics of the industry in its present form.
Explanation of Coworking Value Propositions
| Value Proposition |
|---|
| Space-As-A-Service: Access to affordable office space and office infrastructure (WiFi, furniture, HVAC, mailboxes, etc.) |
| Community: Access to other workers who can provide important-yet-missing social interaction for freelancers, remote workers, contract workers, and small businesses |
| Professional Network: Access to a network of both potential peers and clients, and access to opportunities to learn best practices and new skills, as well as find investment and new business opportunities |
| Work-Life Balance: Access to a work style that allows for a better balance between the demands of a personal and professional identity |
Mapping Coworking: Flexible Work in Cities
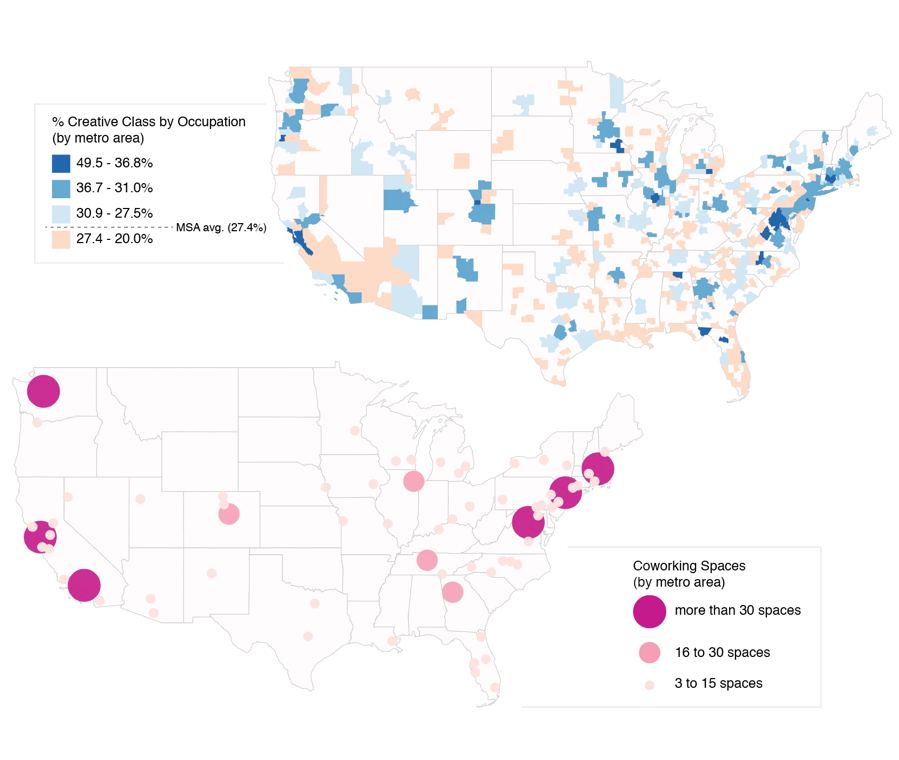
The first major finding from this research is that coworking is an urban phenomenon. Of the 662 spaces in our database, only one space is located outside of a US metro region. The vast majority of the remaining 661 spaces are located in major metro areas across the United States (see table and map).
We found coworking firms concentrated in large metro regions. This stands to reason because coworking firms, like temporary employment firms, will concentrate in places with large labor markets. We tested the hypothesis that coworking firms were concentrated in places with a significant presence of “creative class” workers — the high-tech workers associated with narratives about workers who choose flexibility rather than permanent employment relationships.
We also looked at whether population growth corresponded with the rise of coworking spaces in a given region. The table below presents our initial findings.
Top 10 Metropolitan Statistical Areas with High Concentrations of Coworking Locations and Their Percent of “Creative Class” Occupations, 2016
| Metropolitan Statistical Area | Number of Coworking Locations | Population, 2015 estimate (ranking)1 | Population Growth 2010-20151 | Creative Class Location Quotient2 | Super Creative Core Location Quotient2 |
|---|---|---|---|---|---|
| New York-Newark-Jersey City, NY-NJ-PA | 65 | 20,182,305 (1st) | 2.96% | 1.12 | 1.10 |
| San Francisco-Oakland-Hayward, CA | 62 | 4,656,132 (11th) | 7.15% | 1.27 | 1.34 |
| Seattle-Tacoma-Bellevue, WA | 39 | 3,733,580 (15th) | 8.26% | 1.20 | 1.36 |
| Los Angeles-Long Beach-Anaheim, CA | 38 | 13,340,068 (2nd) | 3.86% | 1.06 | 1.08 |
| Boston-Cambridge-Newton, MA-NH | 32 | 4,774,321 (10th) | 4.58% | 1.213 | 1.103 |
| Washington-Arlington-Alexandria, DC-VA-MD-WV | 32 | 6,097,684 (6th) | 7.61% | 1.48 | 1.53 |
| Chicago-Naperville-Elgin, IL-IN-WI | 28 | 9,551,031 (3rd) | 0.84% | 1.05 | 0.98 |
| Denver-Aurora-Lakewood, CO | 23 | 2,814,330 (19th) | 10.17% | 1.16 | 1.16 |
| Nashville-Davidson-Murfreesboro-Franklin, TN | 18 | 1,830,345 (36th) | 9.21% | 0.99 | 0.82 |
| Atlanta-Sandy Springs-Roswell, GA | 17 | 5,710,795 (9th) | 7.67% | 1.08 | 1.03 |
| MSA Averages4 | 25 | 329,894 | 1.62%6 | 0.927 | 0.928 |
We concluded from this analysis that neither the presence of creative class occupation nor the pace of population growth in a given metro area fully explains the growth of coworking firms. The map below provides some additional support for our conclusion: coworking concentrates in urban labor markets, but variation across urban labor markets has yet to be fully explained.
Our second major finding is that the coworking industry is comprised of two types of firms: single-location firms and multi-sited franchises. This is consistent with the practices that emerged in the temporary employment services industry where large firms such as Adecco and Kelly set up global franchise operations while local temporary service firms emerged in individual cities working in competition and in collaboration with the larger, multi-sited firms in the industry.
Coworking Firms and Number of Individual Operating Locations (Total), 2016
| Number of Coworking Firms | Number of Coworking Locations | |
|---|---|---|
| Total Firms | 468 | 662 |
| Firms with one site | 418 | 418 |
| Firms with between 2 and 5 sites | 39 | 119 |
| Firms with more than 5 sites | 11 | 125 |
Geographic Coverage of Large Coworking Firms, 2016
| Firm Name | Active Spaces Within US | Geographic Coverage |
|---|---|---|
| WeWork | 48 | National |
| Impact Hub | 15 | National |
| The Cove | 11 | Mid-Atlantic & Northeast |
| Industrious | 10 | Northeast, Mid-Atlantic, South, & Mid-West |
| ActivSpace | 10 | Pacific Division |
| Make Offices | 10 | Mid-Atlantic & Mid-West |
Coworking is still a new industry so we do not yet have evidence of how and in what ways the large firms will interact with the single site locations and whether they will compete on the basis of service offerings. We did find that most coworking spaces are private firms that allow membership-based access. Our assessment of the variation in offerings by firm versus by site indicates that there is little variation in core services at present. Further research is planned to ascertain whether variation in core services is, in fact, driven by variation in the labor market (geography) rather than competitive firm strategies.
Frequency of Common Coworking Offerings by Firm and Location, 2016
| Coworking Offering (Value Proposition) | By Firm (Percent) | By Individual Site (Percent) |
|---|---|---|
| Office Infrastructure (Space-As-A-Service) | 78 (100%) | 116 (100%) |
| 24/7 Access | 60 (77%) | 88 (76%) |
| Furniture | 76 (97%) | 114 (98%) |
| Wireless Network Access | 77 (99%) | 115 (99%) |
| Mailbox and/or Mail Services | 45 (58%) | 69 (59%) |
| Printing | 61 (78%) | 99 (85%) |
| Conference/Meeting Rooms | 74 (95%) | 112 (97%) |
| Meeting Tools | 61 (78%) | 98 (84%) |
| Coffee and/or Tea | 73 (94%) | 111 (96%) |
| Kitchen(ette) Access | 50 (64%) | 86 (74%) |
| Social Interaction 9 (Community) | 73 (94%) | 110 (95%) |
| Professional Development 10 (Professional Network) | 54 (69%) | 90 (78%) |
| Work-Life Support 11 (Work-Life Balance) | 49 (63%) | 79 (68%) |
-
Annual Estimates of the Resident Population: April 1, 2010 to July 1, 2015, Source: U.S. Census Bureau, Population Division, Release Date: March 2016. ↩ ↩2
-
Combination of reported counts for occupation categories originally specified by Florida (2012) and later modified (Florida 2016). ↩ ↩2
-
Occupation data collected for the Boston-Cambridge-Nashua, MA-NH Metropolitan NECTA ↩ ↩2
-
MSA Averages are calculated based on data available for all MSAs (LSAD M1), except for occupational reporting. Creative class and super creative core location quotients includes a combination of MSAs and NECTAs (LSAD M5); ↩
-
Average number of coworking spaces includes MSAs where no coworking spaces were recorded. Actual calculated average value mean is 1.67 (median: 0; mode: 0); ↩
-
Median MSA population change: 0.86%; ↩
-
Median creative class location quotient: 0.89; ↩
-
Median super creative core location quotient: 0.87 ↩
-
Social Interaction refers to language on websites that refers to the benefit of being near other workers, either in terms of camaraderie or collaboration. ↩
-
Professional Development includes informal learning (e.g. lunch-and-learns), professional panels, networking events (e.g. meet-ups), and members-only events ↩
-
Work-Life Support refers to various listed amenities such as relaxation areas, gym access, bike storage, dog-friendliness, and wellness programs (i.e. on-site yoga or massage). ↩