Pollen Map and Pollen Calendar

The city of Atlanta, Georgia, has one of the highest annual pollen counts of any city in the United States. Every spring, pollen blankets the city. Pollen counts are orders of magnitude greater than the threshold set for a “High” pollen count by the National Allergy Bureau. These numbers are reported daily on dedicated websites and other media channels. The numbers report the facts of the daily pollen count and signal the dramatic nature of pollen in the city, but they fail to express the experience of living with pollen.
The process of measuring pollen count is laborious and expensive. Every day, an expert must use sophisticated equipment to collect and tally microscopic spores from the previous 24 hours. Because of the exhaustive nature of measurement, pollen counts are collected for large geographic areas only—at city or regional scale. These measures may be useful for tracking wide trends, but their value is limited when applied to the variation between neighborhoods, as distribution and interaction with pollen is affected by conditions like tree cover, landscaping, wind patterns, architecture, and infrastructure.
In response to these common methods and forms of pollen counting and reporting we designed two tools: the Pollen Calendars and the Pollen Map. These design of these tools was motivated by two principles: 1) to emphasize local details over macro-scale abstractions and 2) to emphasize the anecdotal expression of pollen over the generic reporting of facts.
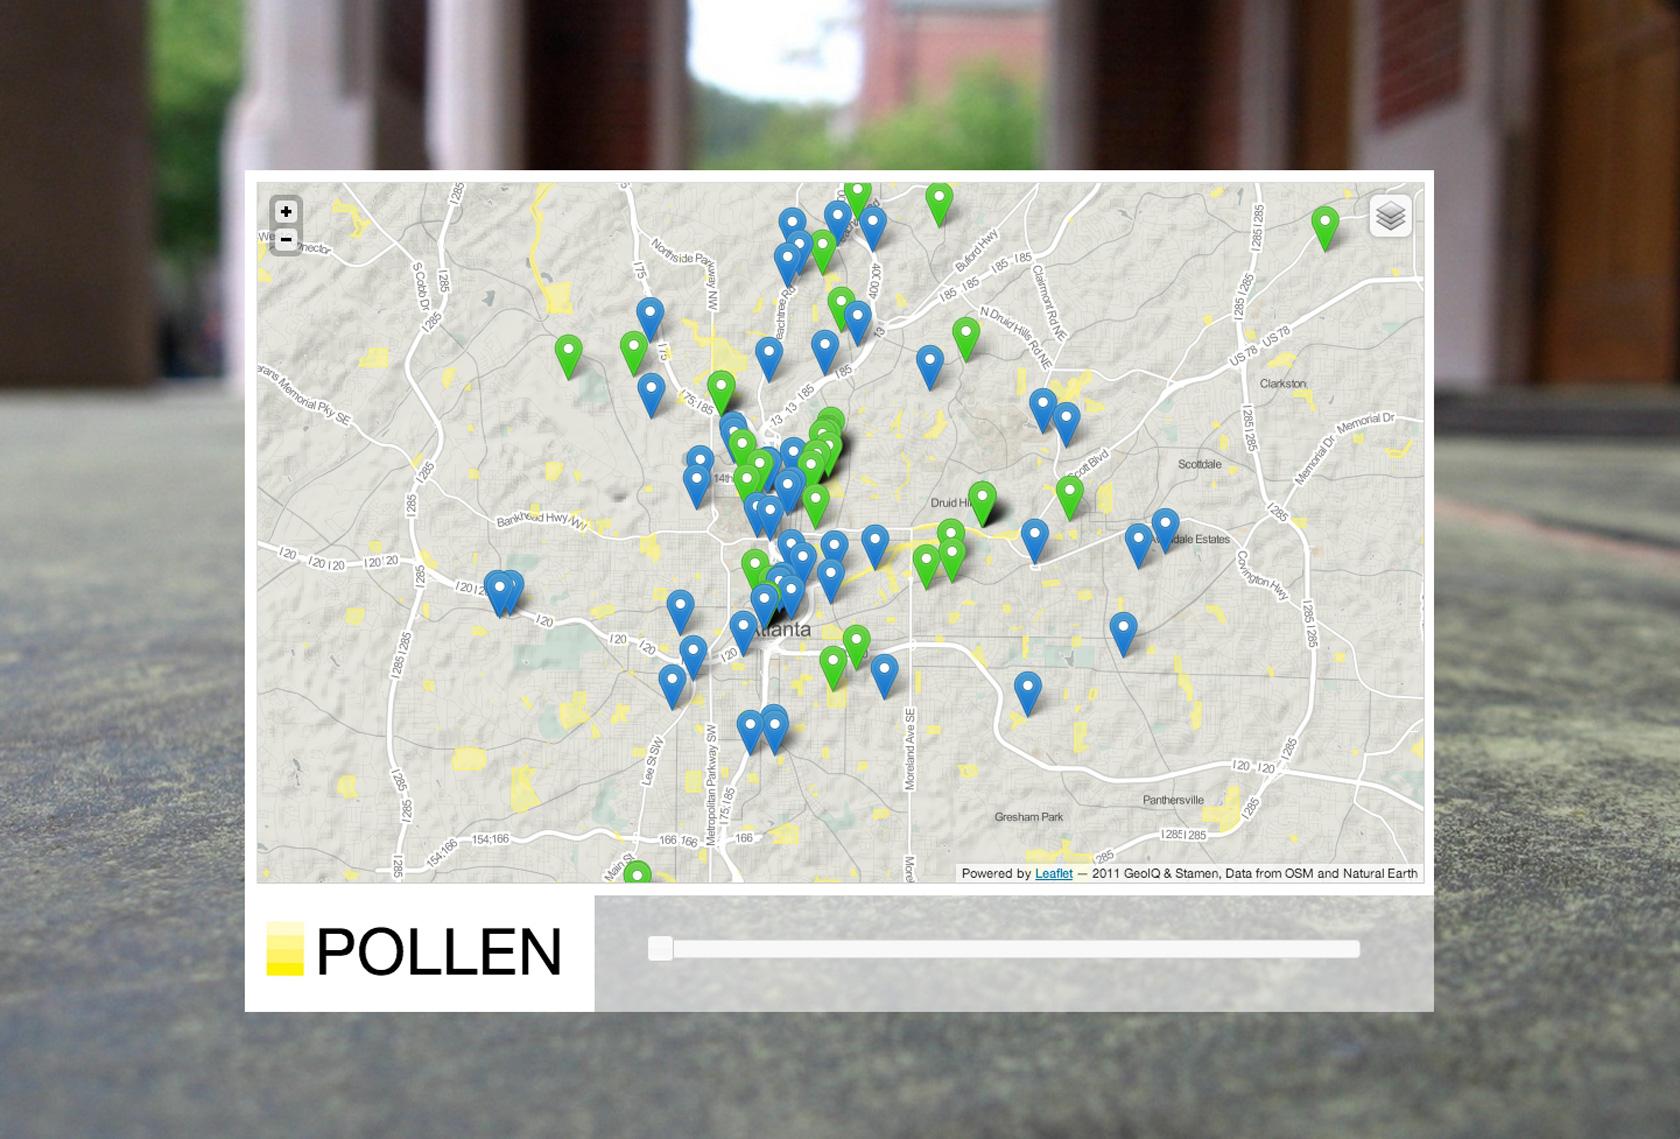
The Pollen Map provides a way for individuals to view and compare the aggregate experience of pollen in different localities. The pollen data reported is drawn from social media, and as such, provides a more personal and interpretive expression of the experience of pollen. Specifically, the Pollen Map is an online digital map integrated with user-generated text and images. A script searches Twitter and Flickr for geo-located content with relevant keywords and tags (such as ‘pollen,’ ‘allergies,’ etc.). This content is scraped and stored in the Pollen Map database. In addition, users can choose to tag tweets with the hashtag #pollenATL, adding the contents of those tweets, including username, timestamp, texts and images, to the Pollen Map database.
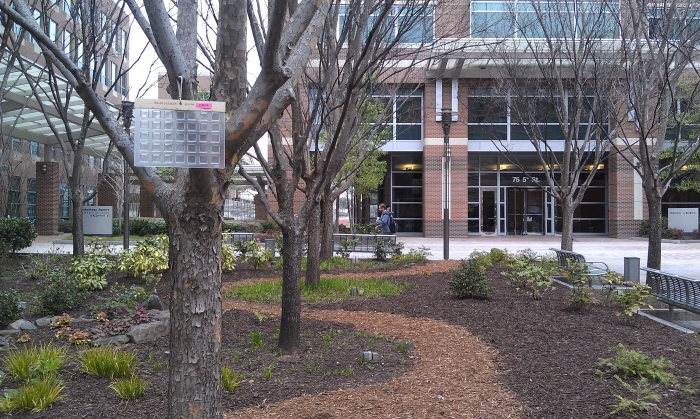
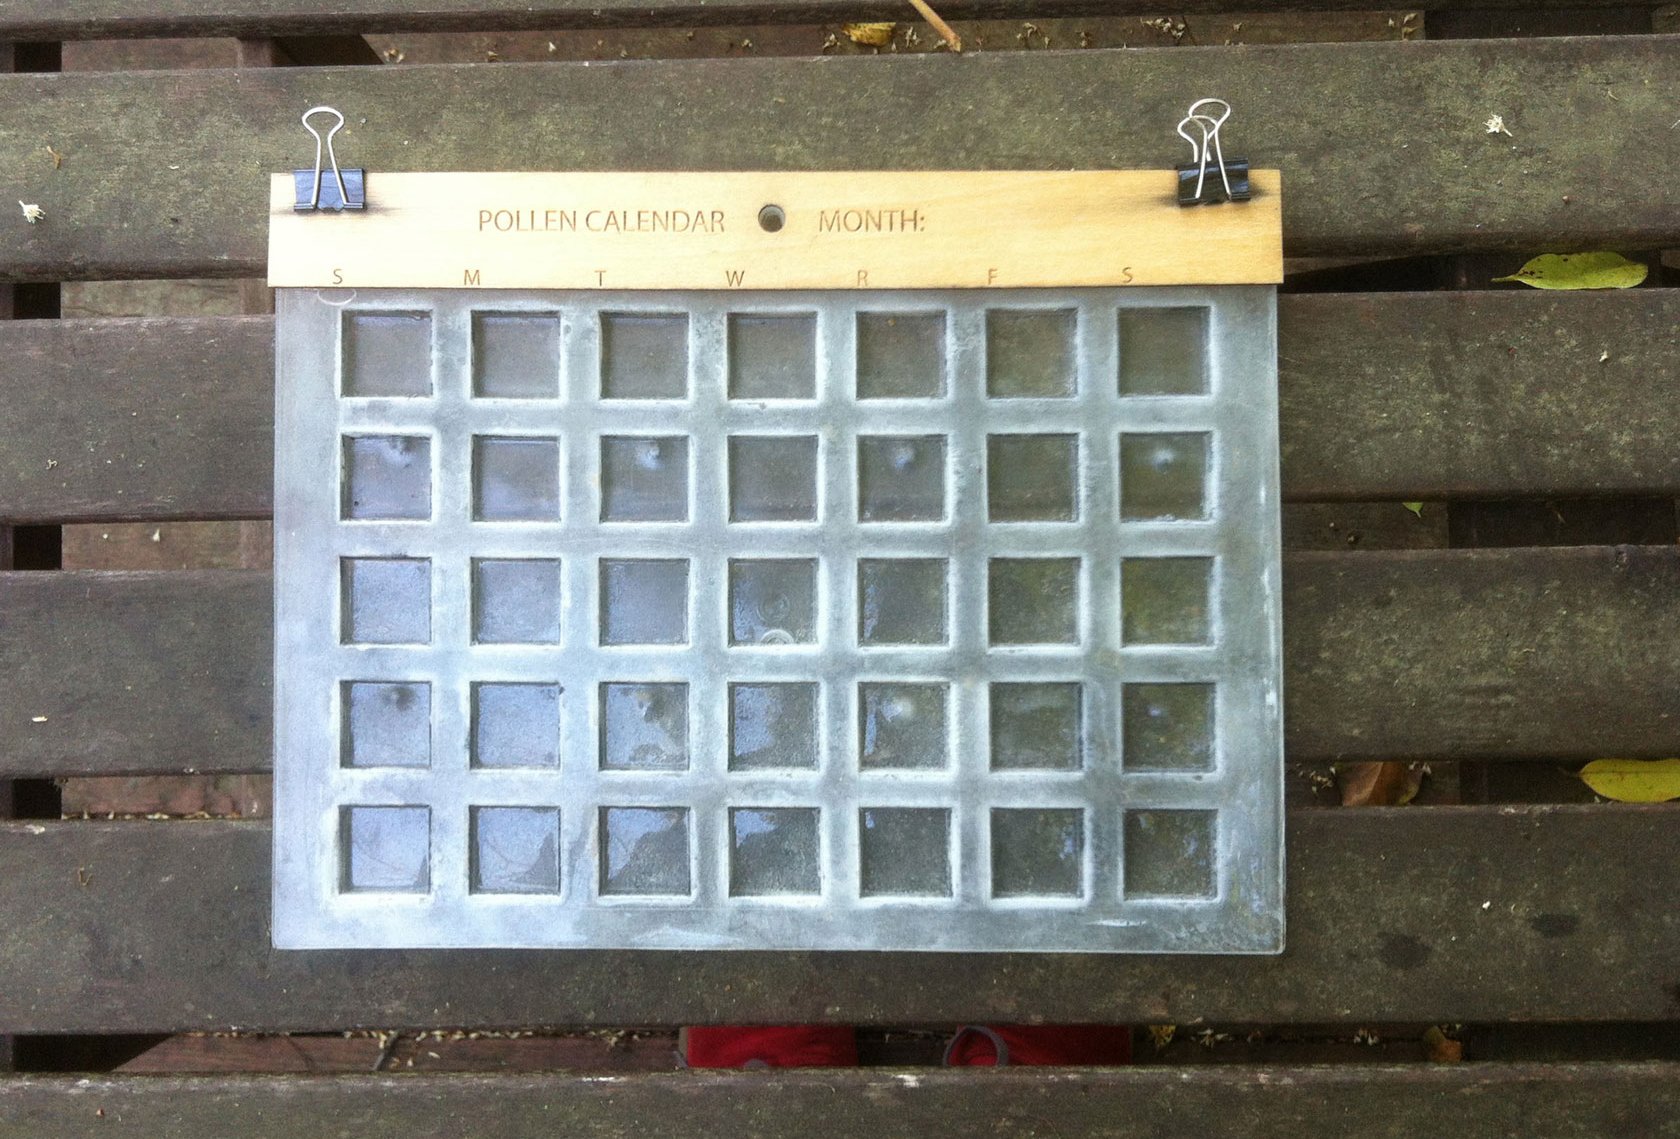
Pollen Calendars provide a way for individuals to enact their own localized pollen measurements in a manner that calls attention to the materiality of pollen. The Pollen Calendars are analog sensing platforms constructed from vacuum-formed plastic. Each calendar is approximately 30cm by 20cm, and has 31 recessed wells and laser-cut labels that provide markers for the days of the week. A sheet of clear acetate is affixed over the calendar and a flap is cut into it over each plastic well, allowing it to be opened and closed. Each well is lined with petroleum jelly. Pollen adheres to the jelly when the well is opened and exposed to air.
–
Pollen Calendar Development
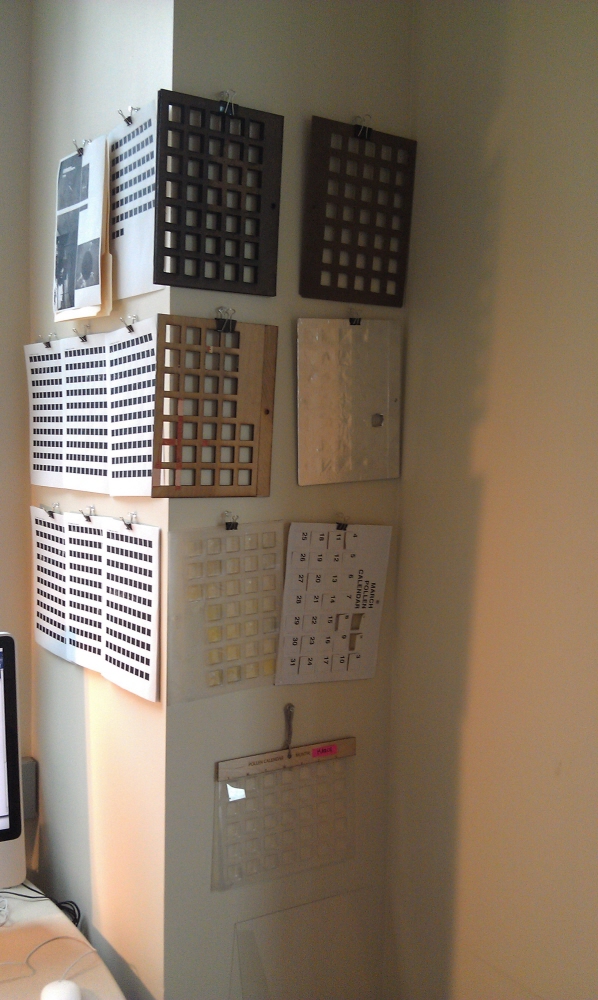
Part of my research into the Pollen Calendar and Pollen Map was to develop the Pollen Calendar. The following are images of various stages of the prototypes.
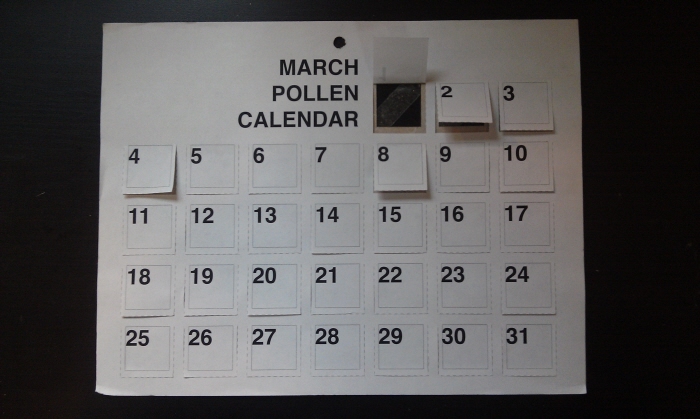
The first round of prototypes used double-sided tape to gather pollen. This reduced the surface to which pollen could adhere. As a result, I decided to create a calendar with wells.
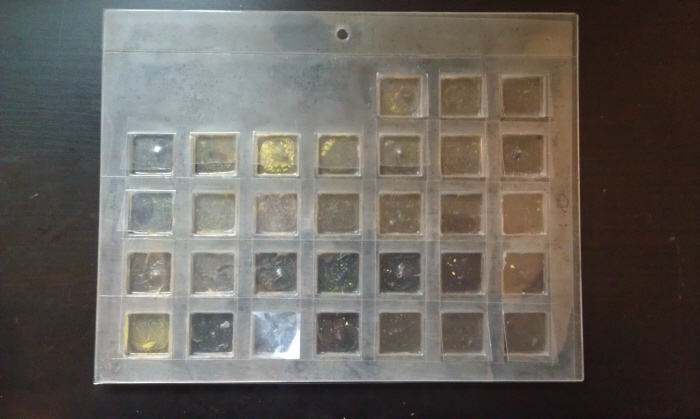
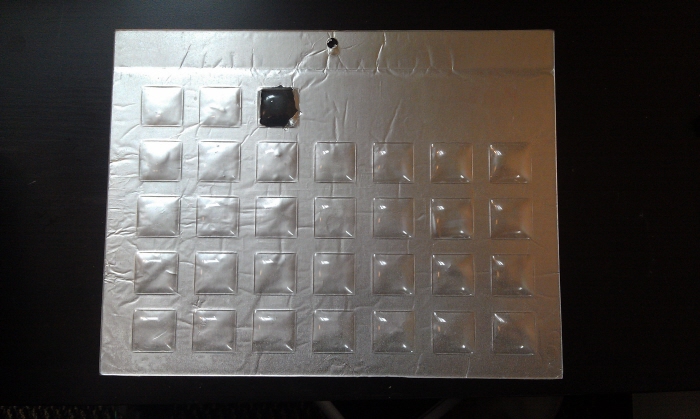
The second round prototypes for the Pollen Calendar featured wells after the first prototypes were insufficient. During this phase, I figured out how to mold wells using a vacuum form. This led to a secondary problem: I needed a way to cover the wells that were not being used from collecting pollen. The first image shows a calendar with clear plastic flaps covering wells. The second image shows an aluminum blister covering. I decided to use the first option since it could be reused.
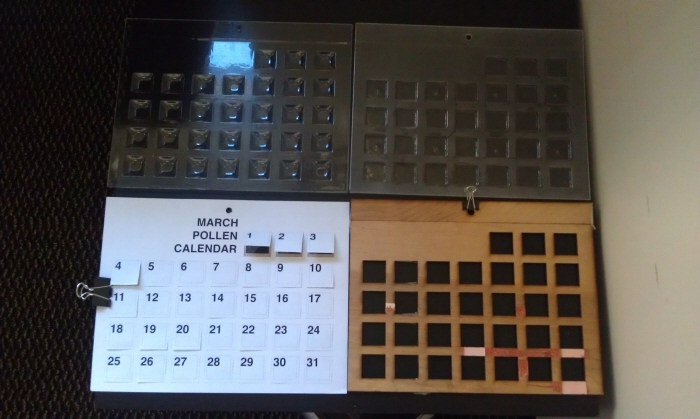
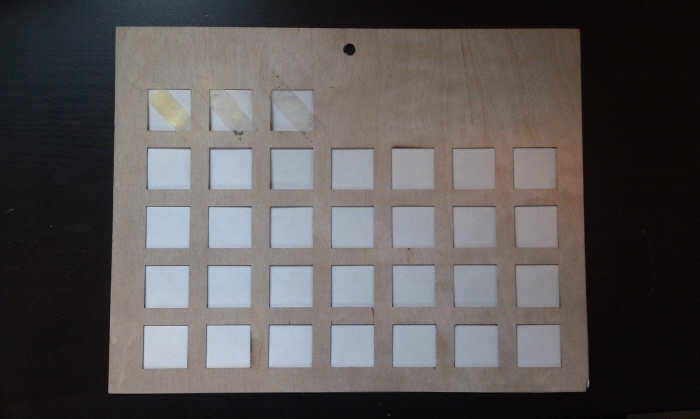
After vacuum forming a series of calendars, I decided to change materials for the molds. The original plywood chipped when used more than once. Instead, I laser-cut compressed particle board. This ended up causing different issues during molding. The particle board was pourous and was difficult to separate from the plastic. I used a lubricant to make the plastic and mold easier to pull apart. The lubricant made the plastic cloudy however.
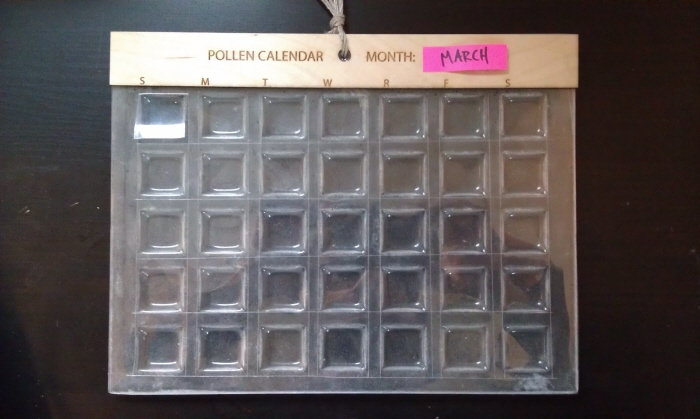
The final prototype featured 35 wells. This meant the calendar could be used for a variety of months.